DDAS Equipment Performance Library Manual
About this documentation
This documentation provides essential information for working with components of the DDAS software ecosystem. It is intended for software developers and machine manufacturers who integrate, validate, and operate DDAS function blocks within CODESYS‑based applications.
Note!
Before installing or configuring any software, ensure that you have read and understood the operating instructions of all relevant hardware devices!
Tip!
Further information can be found at: https://www.ddas.digital
This manual is part of the DDAS library collection, which includes documentation for license management, date and time handling, scheduling, equipment performance, and other functional modules:
| Documentation | Subject |
|---|---|
| DDAS LicenseManager Library Manual | Description and usage of the library license management function blocks |
| DDAS DateTime Library Manual | Description and usage of the library date time function block. |
| DDAS Scheduler Library Manual | Description and usage of the library scheduler function block. |
| DDAS EquipmentPerformance Library Manual | Description and usage of the library Equipment Performance function block. |
Document history
| Version | Description | ||
|---|---|---|---|
| 1.0 | 08.05.2026 | DDAS | Initial version |
General
Library
This library provides a comprehensive solution for real-time monitoring and historical tracking of equipment performance. It enables the calculation and analysis of key performance indicators (KPIs) such as production counts, overall equipment effectiveness (OEE), performance rates, and loss metrics across different operational contexts, including batches, shifts, or product runs.
In addition to real-time evaluation, the library supports the structured capture and storage of performance data over time. This allows for detailed trend analysis, traceability, and long-term performance assessment.
The solution includes capabilities for identifying and analysing production losses and operational states, helping to improve transparency and support continuous optimization of manufacturing processes.
The library includes the following user function blocks:
EquipmentPerformance
EP_History
EquipmentPerformance
This Function block calculating and tracking key equipment performance indicators (KPIs), including production counts,
OEE, performance rates, and loss analysis, for an active batch, shift, or product run.
EP_History
This Function block stores equipment performance data into historical arrays, capturing snapshots of performance, production, loss, and top-state metrics from the EquipmentPerformance function block.
Detailed descriptions of the function blocks and their relevant dependencies are provided in the following chapters.
Licensing Concept
All libraries require a valid license. Each license is based on three mandatory keys:
SiteCode
Provided by the user (e.g. ‘DDAS-Site-License’)LibraryGuid
Delivered with the library (e.g. ‘{LIB-DDAS-D5BA612E}’)LibraryActivationKey
Issued by DDAS (e.g. ‘EDB86DA0’)
License Activation Mechanism
To activate a library license, one instance of the function block
Get_Lib_License must be called for each licensed
library.
This function block is part of the
DDAS_LicenseManager_Lib library.
Licensing Process
The following steps are required to license and use a library:
The user selects the required libraries.
The user integrates the selected libraries into a test project or uses the provided demo program and evaluates them using the time‑limited demo license.
If the user intends to use the library function blocks in a machine application, the library is ordered and the selected SiteCode is sent to DDAS.
DDAS provides the corresponding LibraryActivationKey.
In the machine application, the user instantiates the function block Get_Lib_License once for each library and assigns all required license keys to activate the library license.
After successful activation, all function blocks of the licensed library can be implemented and executed.
Note: Detailed information on how to use the function block Get_Lib_License is provided in the software manual of the library DDAS_LicenseManager_Lib.
Note: The function Get_sError is available in every library and provides access to the error description and enumeration corresponding to a function block’s error code, when required.
FB EquipmentPerformance
General Information
This chapter describes the function block EquipmentPerformance.
Function Block Name: EquipmentPerformance
Library: DDAS_ EquipmentPerformance_Lib
Dependent Coveys libraries: Nonel
CODESYS Version Compatibility: CODESYS V3.5 and higher
License / Usage Restrictions: Requires valid full or demo library license
Purpose & Scope
This Function block calculating and tracking key equipment performance indicators (KPIs), including production counts, OEE, performance rates, and loss analysis, for an active batch, shift, or product run.
It processes production data, schedules, and state information to generate detailed KPIs, production insights, and loss analytics, supporting performance optimization, OEE tracking, and reporting at batch, shift, or product level.
Typical Use Cases
This function block is used in industrial automation systems to monitor and analyse machine performance in real time.
Functional Overview
When enabled, the Equipment Performance function block provides real-time calculation and tracking of key equipment performance indicators (KPIs) for an active production context, such as a batch, shift, or product run.
It continuously processes operational inputs including production counts, product cycle time, machine performance targets, equipment states, and time information to generate a comprehensive view of machine efficiency and productivity.
The function block evaluates production output by distinguishing
between good (OK) and defective (NOK) units and compares actual
performance against planned production rates. Based on this data, it
calculates key metrics such as performance rates and overall equipment
effectiveness (OEE), enabling transparent assessment of production
efficiency.
In addition to production metrics, the function block monitors equipment
states to identify and categorize production losses. It analyzes
downtime, scheduled breaks, and operational conditions to provide
detailed loss information and supports prioritization through top-state
analysis, highlighting the most significant contributors to reduced
performance.
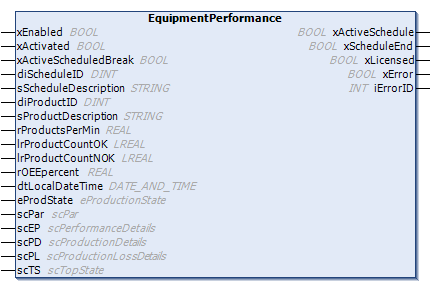
The solution manages lifecycle events of production schedules, including activation and completion, ensuring that KPI tracking is aligned with the current operational context. It also handles transitions between production runs by resetting and reinitializing relevant data at the end of each schedule.
All calculated KPIs and analytical results are made available through structured data outputs, enabling further processing, visualization, or storage in higher-level systems. Built-in status and diagnostic signals provide transparency regarding execution state, licensing, and potential errors, ensuring reliable integration into industrial automation environments.
Note: Multiple instances can be used in parallel. For example, one instance can monitor batch or shift OEE KPIs, while another instance can be used to track product-specific OEE KPIs.
Interface Description
Function block Inputs and Outputs
| Scope | Name | Type | Comment |
|---|---|---|---|
| Input | xEnabled | BOOL | Enables execution of the function block when TRUE. |
| xActivated | BOOL | TRUE = Active shift schedule, batch or product run | |
| xActiveScheduledBreak | BOOL | Active scheduled break from production schedule/calendar | |
| diScheduleID | DINT | Shift or Batch run Description ; can be 0 by product run | |
| sScheduleDescription | STRING | Shift or Batch run Description ; can be empty string by product run | |
| diProductID | DINT | Running product ID | |
| sProductDescription | STRING | Product type or ID Description | |
| rProductsPerMin | REAL | Planned Machine Performance in products per min. (valid value between >= 0.001 and <= 10000) | |
| lrProductCountOK | LREAL | Product OK count | |
| lrProductCountNOK | LREAL | Product NOK count | |
| rOEEpercent | REAL | Actual or average OEE in percent e.g 80.5% (expected value between > 0.1 and <= 100 , Limit 999%), 0% will be set to 100% | |
| dtLocalDateTime | DT | Local Date and Time | |
| eProdState | eProductionState | Production states and Downtime losses | |
| scPar | scPar | Equipment Performance input parameter | |
| Inout | scEP | scPerformanceDetails | Equipment performance KPI’s about the active scheduled batch, shift, or product run. |
| scPD | scProductionDetails | Detailed information about the active scheduled batch, shift, or product run. | |
| scPL | scProductionLossDetails | Detailed information about the losses of the active scheduled batch, shift, or product run. | |
| scTS | scTopState | Top-state analysis of the duration and occurrences of losses in the active scheduled batch, shift, or product run. | |
| Output | xActiveSchedule | BOOL | Valid active schedule and KPI calculation |
| xScheduleEnd | BOOL | TRUE for one PLC cycle on end of schedule; all output date get be cleared and reseted on the next PLC cycle | |
| xLicensed | BOOL | TRUE when a valid full or demo library license is active | |
| xError | BOOL | TRUE if an error or warning is detected. Detailed error information is provided in iErrorID | |
| iErrorID | INT | Error and status identifier for diagnostics |
Execution & Timing Behaviour
The function block is intended to be executed cyclically in a task context.
Timing precision depends on the configured task cycle time and target platform
Error Handling & Diagnostics
If an internal error, a library issue, or a licensing problem occurs, xError is set to TRUE and iErrorID provides the corresponding error code. Detailed descriptions of the error codes are defined in the enumeration eError.
Assumptions & Limitations
Accuracy depends on the system clock. Hardware‑dependent behavior may vary across different CODESYS platforms.
The function block KPI calculation is restricted to a 49-day window. If the required build time extends beyond this period, the function block cannot provide a valid result.
Before ordering this library, please verify the correct functionality of the library function block in your target system.
Example Implementation
Declaration and Call of the Function Block EquipmentPerformance:
GVL_MIF:
VAR_GLOBAL
| xActiveSchedule | : BOOL; | // TRUE when a shift or batch schedule is currently active. |
|---|---|---|
| xActiveBreak | : BOOL; | // TRUE when a break schedule is currently active. |
| diJobID | : DINT; | // Batch ID |
| sActiveScheduleDesc | : STRING; | // Active schedule description of Shift schedule or JobID |
| diProductID | : DINT; | // Running product ID |
| sProductDescription | : STRING; | // Product type or ID Description |
| rProductsPerMin | : REAL; | // Planned Machine Performance in products per min. (valid value between >= 0.001 and <= 10000) |
| lrActualBuildOK | : LREAL; | Actual build products, if no parts are made it is zero (0) |
| lrActualBuildNOK | : LREAL; | Actual build scrap products, if no parts are made it is zero (0) |
| rOEEpercent | : REAL; | // Actual or average OEE in percent e.g 80.5% (expected value between > 0.1 and <= 100 %, Limit 999%), 0% will be set to 100% |
| dtLocalDateTime | : DT; | // Local Date and Time |
END_VAR
GVL_Par_EP:
VAR_GLOBAL
| scPar | : DDAS_EP.scPar; | // Parameter Input structure FB EquipmentPerformance |
|---|---|---|
| eProdState | : DDAS_EP.eProductionState; | // Production states |
END_VAR
GVL_Par_EP_History:
VAR_GLOBAL
| scEP | : DDAS_EP.scPerformanceDetails; | // Equipment performance KPI's about the active scheduled batch, shift, or product run |
|---|---|---|
| scPD | : DDAS_EP.scProductionDetails; | // Detailed information about the active scheduled batch, shift, or product run |
| scPL | : DDAS_EP.scProductionLossDetails; | // Detailed information about the losses of the active scheduled batch, shift, or product run |
| scTS | : DDAS_EP.scTopState; | // Top-state analysis of the duration and occurrences of losses in the active scheduled batch, shift, or product run |
END_VAR
VAR
fb_EP : DDAS_EP.EquipmentPerformance;
END_VAR
FB call in structure text:
fb_ EP(
xEnabled := TRUE,
xActivated := GVL_MIF.xActiveSchedule,
xActiveScheduledBreak := GVL_MIF.xActiveBreak,
diScheduleID := GVL_MIF.diJobID,
sScheduleDescription := GVL_MIF.sActiveScheduleDesc,
diProductID := GVL_MIF.diProductID,
sProductDescription := GVL_MIF.sProductDescription,
rProductsPerMin := GVL_MIF.rProductsPerMin,
lrProductCountOK := GVL_MIF.lrActualBuildOK,
lrProductCountNOK := GVL_MIF.lrActualBuildNOK,
rOEEpercent := GVL_MIF.rOEEpercent,
dtLocalDateTime := GVL_MIF.dtLocalDateTime,
eProdState := GVL_Par_EP.eProdState,
scPar := GVL_Par_EP.scPar,
scEP := GVL_EP_History.scEP,
scPD := GVL_EP_History.scPD,
scPL := GVL_EP_History.scPL,
scTS := GVL_EP_History.scTS
);
FB call in continuous function chart diagram:
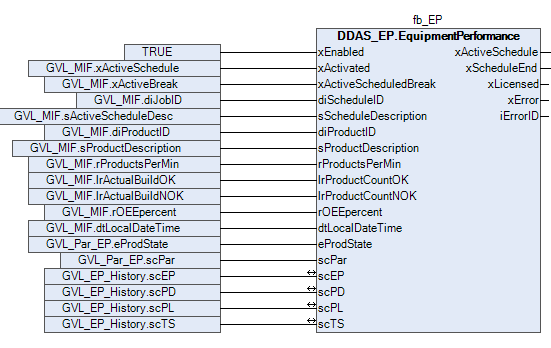
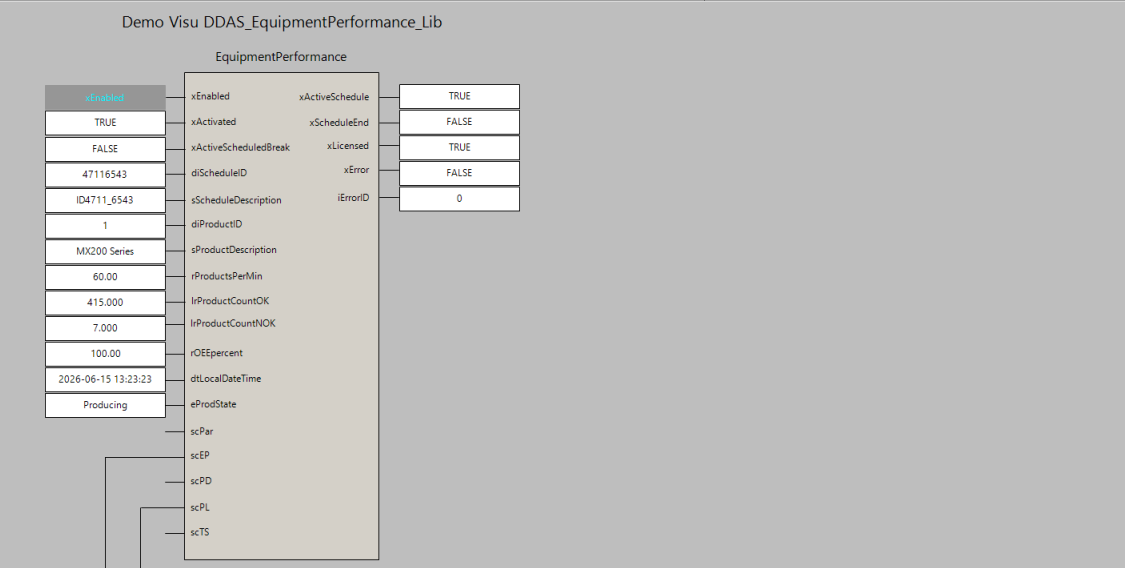
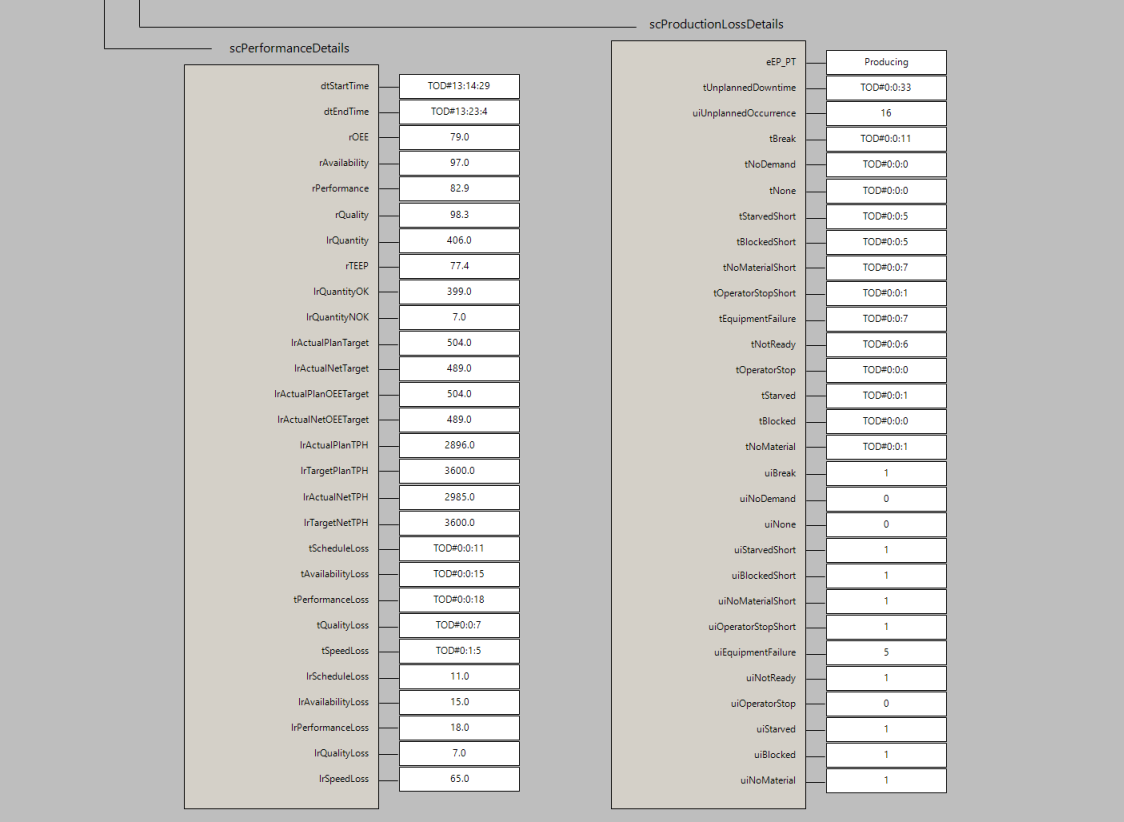
Function block sample input and output parameter:
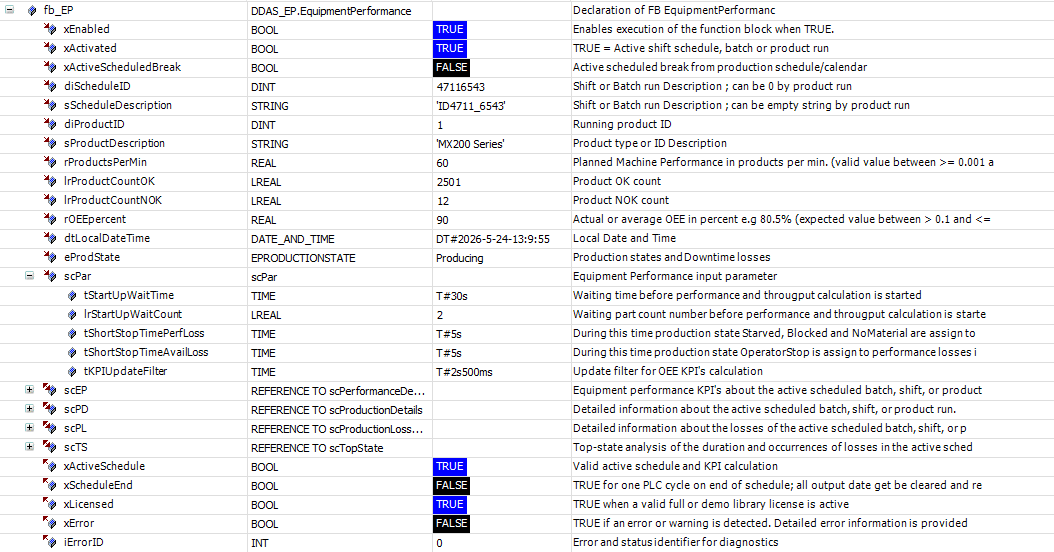
Screenshot example in Online / Monitor mode
Demo Visualisation
FB EP_History
General Information
This chapter describes the function block EP_History.
Function Block Name: EP_History
Library: DDAS_EquipmentPerformance_Lib
Dependent Codesys libraries: None
CODESYS Version Compatibility: CODESYS V3.5 and higher
License / Usage Restrictions: Requires valid full or demo library license
Purpose & Scope
his Function block stores equipment performance data into historical arrays, capturing snapshots of performance, production, loss, and top-state metrics from the EquipmentPerformance function block.
This function block is used to maintain a rolling history of equipment performance data for analysis, visualization, and reporting.
It enables controlled storage and clearing of historical KPI datasets, preserving time-based snapshots in reverse chronological order.
Typical Use Cases
Typical applications include trend analysis, dashboard visualization, batch/shift comparison, and short-term buffering of performance data for higher-level systems such as SCADA, MES, or cloud analytics.
Functional Overview
When enabled, the Equipment Performance History function block provides structured storage and management of time-based equipment performance data. It captures snapshots of key performance datasets, including performance metrics, production details, loss information, and top-state analysis, and organizes them into historical records for further use.
The function block enables selective recording of different data categories, allowing flexible control over which information is stored. Data is captured on demand and inserted into history buffers in reverse chronological order, ensuring that the most recent dataset is always immediately accessible while maintaining a defined history depth.
In addition to data storage, the function block supports controlled clearing of historical records, enabling reset operations when required, such as at the start of new production phases or for memory management purposes.
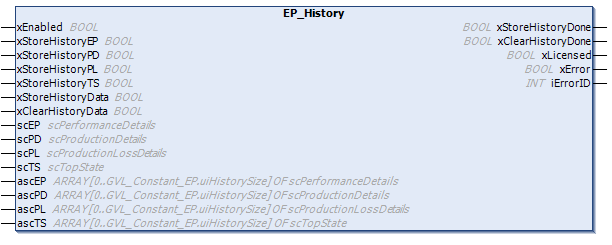
The stored historical data can be used for trend analysis, visualization, and reporting in higher-level systems. This supports use cases such as performance monitoring over time, comparison of batches or shifts, and short-term buffering of KPIs before transfer to SCADA, MES, or cloud-based analytics platforms.
Status signals indicate the successful execution of storage and clearing operations, while integrated diagnostic outputs provide transparency regarding licensing status and potential errors. This ensures reliable and traceable operation within industrial automation environments.
Note: Multiple instances can be used in parallel. For example, one instance can store history data of batch or shift OEE KPIs, while another instance can be used to store history data of product-specific OEE KPIs.
Interface Description
Function block Inputs and Outputs
| Scope | Name | Type | Comment |
|---|---|---|---|
| Input | xEnabled | BOOL | Enables execution of the function block when TRUE. |
| xStoreHistoryEP | BOOL | Store history Performance Details data | |
| xStoreHistoryPD | BOOL | Store history Production Details data | |
| xStoreHistoryPL | BOOL | Store history Production Loss Details data | |
| xStoreHistoryTS | BOOL | Store history Top State data | |
| xStoreHistoryData | BOOL | On rising True store History data | |
| xClearHistoryData | BOOL | On rising True clear History data | |
| Inout | scEP | scPerformanceDetails | Input Performance Details data |
| scPD | scProductionDetails | Input Production Details data | |
| scPL | scProductionLossDetails | Input Production Loss Details data | |
| scTS | scTopState | Input Top State data | |
| ascEP | ARRAY [0..GVL_Constant_EP.uiHistorySize] OF scPerformanceDetails | History Performance Details data (Values are stored in reverse chronological order, with index 0 representing the newest entry and index 9 the oldest) | |
| ascPD | ARRAY [0..GVL_Constant_EP.uiHistorySize] OF scProductionDetails | History Production Details data (Values are stored in reverse chronological order, with index 0 representing the newest entry and index 9 the oldest) | |
| ascPL | ARRAY [0..GVL_Constant_EP.uiHistorySize] OF scProductionLossDetails | History Production Loss Details data (Values are stored in reverse chronological order, with index 0 representing the newest entry and index 9 the oldest) | |
| ascTS | ARRAY [0..GVL_Constant_EP.uiHistorySize] OF scTopState | History Top State data (Values are stored in reverse chronological order, with index 0 representing the newest entry and index 9 the oldest) | |
| Output | xStoreHistoryDone | BOOL | IF TRUE history data are stored; TRUE for one PLC cycle |
| xClearHistoryDone | BOOL | IF TRUE history data are cleared; TRUE for one PLC cycle | |
| xLicensed | BOOL | TRUE when a valid full or demo library license is active | |
| xError | BOOL | TRUE if an error or warning is detected. Detailed error information is provided in iErrorID | |
| iErrorID | INT | Error and status identifier for diagnostics |
Execution & Timing Behaviour
The function block is intended to be executed cyclically in a task context.
Timing precision depends on the configured task cycle time and target platform
Error Handling & Diagnostics
If an internal error, a library issue, or a licensing problem occurs, xError is set to TRUE and iErrorID provides the corresponding error code. Detailed descriptions of the error codes are defined in the enumeration eError.
Assumptions & Limitations
Accuracy depends on the system clock. Hardware‑dependent behavior may vary across different CODESYS platforms.
Before ordering this library, please verify the correct functionality of the library function block in your target system.
Example Implementation
Declaration and Call of the Function Block EP_History:
GVL_Par_EP:
VAR_GLOBAL
| xScheduleEnd | : BOOL; | // TRUE for one PLC cycle on end of schedule; all output date get be cleared and reseted on the next PLC cycle |
|---|---|---|
| xClearHistoryData | : BOOL; | // On rising True clear History data |
END_VAR
GVL_Par_EP_History:
VAR_GLOBAL
| scEP | : DDAS_EP.scPerformanceDetails; | // Equipment performance KPI's about the active scheduled batch, shift, or product run |
|---|---|---|
| scPD | : DDAS_EP.scProductionDetails; | // Detailed information about the active scheduled batch, shift, or product run |
| scPL | : DDAS_EP.scProductionLossDetails; | // Detailed information about the losses of the active scheduled batch, shift, or product run |
| scTS | : DDAS_EP.scTopState; | // Top-state analysis of the duration and occurrences of losses in the active scheduled batch, shift, or product run |
| ascEP | : ARRAY[0..DDAS_EP.GVL_Constant_EP.uiHistorySize] OF DDAS_EP.scPerformanceDetails; | // History Equipment performance KPI's about the active scheduled batch, shift, or product run |
| ascPD | : ARRAY[0..DDAS_EP.GVL_Constant_EP.uiHistorySize] OF DDAS_EP.scProductionDetails; | // History detailed information about the active scheduled batch, shift, or product run |
| ascPL | : ARRAY[0..DDAS_EP.GVL_Constant_EP.uiHistorySize] OF DDAS_EP.scProductionLossDetails; | // History detailed information about the losses of the active scheduled batch, shift, or product run |
| ascTS | : ARRAY[0..DDAS_EP.GVL_Constant_EP.uiHistorySize] OF DDAS_EP.scTopState; | // History Top-state analysis of the duration and occurrences of losses in the active scheduled batch, shift, or product run |
END_VAR
VAR
fb_EP_History : DDAS_EP.EP_History;
END_VAR
FB call in structure text:
fb_EP_History(
xEnabled := TRUE,
xStoreHistoryEP := TRUE,
xStoreHistoryPD := TRUE,
xStoreHistoryPL := TRUE,
xStoreHistoryTS := TRUE,
xStoreHistoryData := GVL_Par_EP.xScheduleEnd,
xClearHistoryData := GVL_Par_EP.xClearHistoryData,
scEP := GVL_EP_History.scEP,
scPD := GVL_EP_History.scPD,
scPL := GVL_EP_History.scPL,
scTS := GVL_EP_History.scTS,
ascEP := GVL_EP_History.ascEP,
ascPD := GVL_EP_History.ascPD,
ascPL := GVL_EP_History.ascPL,
ascTS := GVL_EP_History.ascTS
);
FB call in continuous function chart diagram:
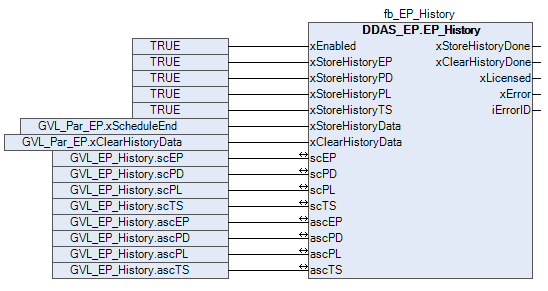
Function block sample input and output parameter:
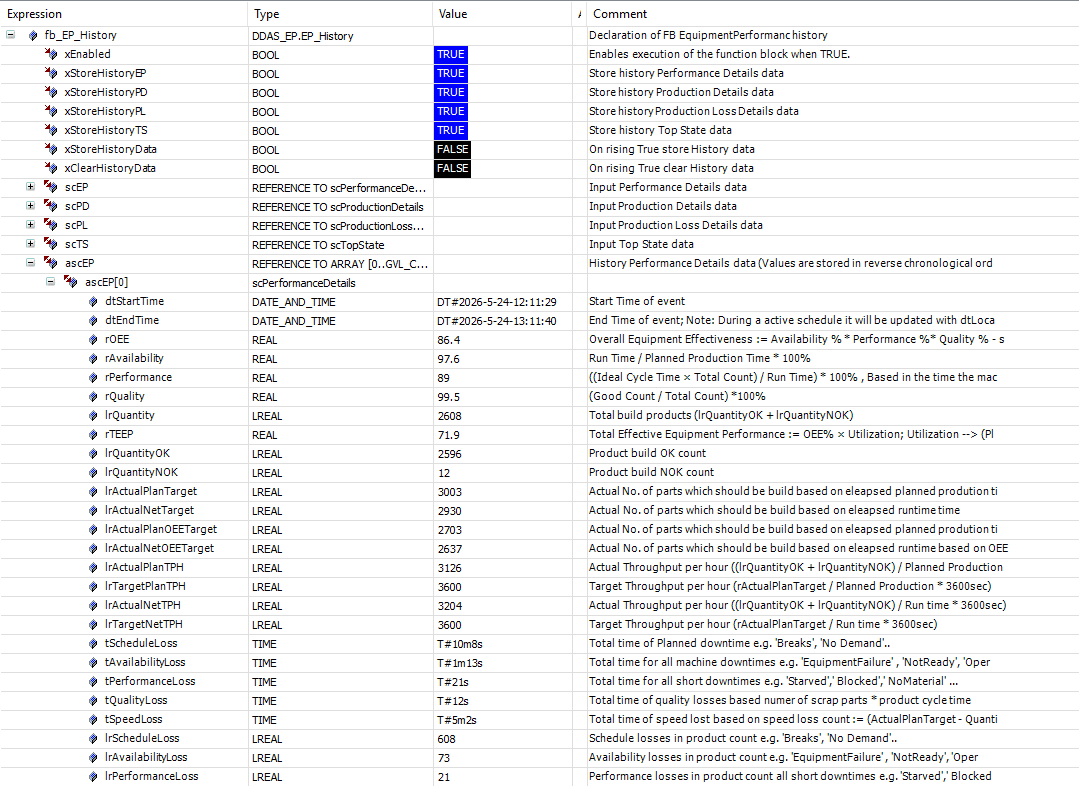
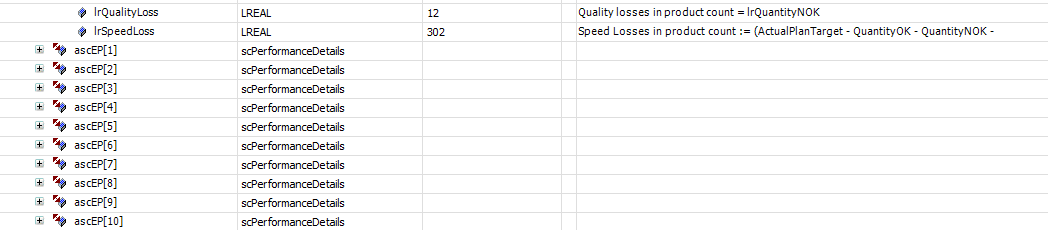
Screenshot example in Online / Monitor mode
Global
Structures
scPar
This structure provides input user‑configuration.
| Name | Type | Initial | Comment |
|---|---|---|---|
| tStartUpWaitTime | TIME | TIME#5m0s0ms | Waiting time before performance and througput calculation is started |
| lrStartUpWaitCount | LREAL | 10 | Waiting part count number before performance and througput calculation is started |
| tShortStopTimePerfLoss | TIME | TIME#10s0ms | During this time production state Starved, Blocked and NoMaterial are assign to performance losses otherwise to availability losses |
| tShortStopTimeAvailLoss | TIME | TIME#30s0ms | During this time production state OperatorStop is assign to performance losses instead to availability losses |
| tKPIUpdateFilter | TIME | TIME#5s0ms | Update filter for OEE KPI’s calculation |
scPerformanceDetails
This structure provides Equipment performance KPI’s about the active scheduled batch, shift, or product run.
| Name | Type | Comment |
|---|---|---|
| dtStartTime | DT | Start Time of event |
| dtEndTime | DT | End Time of event; Note: During a active schedule it will be updated with dtLocalDateTime and freeze on the end of the schedule |
| rOEE | REAL | Overall Equipment Effectiveness := Availability % * Performance %* Quality % - shift based |
| rAvailability | REAL | Run Time / Planned Production Time * 100% |
| rPerformance | REAL | ((Ideal Cycle Time × Total Count) / Run Time) * 100% , Based in the time the machine is in production |
| rQuality | REAL | (Good Count / Total Count) *100% |
| lrQuantity | LREAL | Total build products (lrQuantityOK + lrQuantityNOK) |
| rTEEP | REAL | Total Effective Equipment Performance := OEE% × Utilization; Utilization –> (Planned Production Time / All Time) |
| lrQuantityOK | LREAL | Product build OK count |
| lrQuantityNOK | LREAL | Product build NOK count |
| lrActualPlanTarget | LREAL | Actual No. of parts which should be build based on eleapsed planned prodution time |
| lrActualNetTarget | LREAL | Actual No. of parts which should be build based on eleapsed runtime time |
| lrActualPlanOEETarget | LREAL | Actual No. of parts which should be build based on eleapsed planned prodution time based on OEE target |
| lrActualNetOEETarget | LREAL | Actual No. of parts which should be build based on eleapsed runtime based on OEE target |
| lrActualPlanTPH | LREAL | Actual Throughput per hour ((lrQuantityOK + lrQuantityNOK) / Planned Production * 3600sec) |
| lrTargetPlanTPH | LREAL | Target Throughput per hour (rActualPlanTarget / Planned Production * 3600sec) |
| lrActualNetTPH | LREAL | Actual Throughput per hour ((lrQuantityOK + lrQuantityNOK) / Run time * 3600sec) |
| lrTargetNetTPH | LREAL | Target Throughput per hour (rActualPlanTarget / Run time * 3600sec) |
| tScheduleLoss | TIME | Total time of Planned downtime e.g. ‘Breaks’, ‘No Demand’.. |
| tAvailabilityLoss | TIME | Total time for all machine downtimes e.g. ‘EquipmentFailure’ , ‘NotReady’, ‘OperatorStop’… |
| tPerformanceLoss | TIME | Total time for all short downtimes e.g. ‘Starved’,’ Blocked’,’ NoMaterial’ … |
| tQualityLoss | TIME | Total time of quality losses based numer of scrap parts * product cycle time |
| tSpeedLoss | TIME | Total time of speed lost based on speed loss count := (ActualPlanTarget - QuantityOK - QuantityNOK - AvailabilityLoss - PerformanceLoss) |
| lrScheduleLoss | LREAL | Schedule losses in product count e.g. ‘Breaks’, ‘No Demand’.. |
| lrAvailabilityLoss | LREAL | Availability losses in product count e.g. ‘EquipmentFailure’ , ‘NotReady’, ‘OperatorStop’… |
| lrPerformanceLoss | LREAL | Performance losses in product count all short downtimes e.g. ‘Starved’,’ Blocked’,’ NoMaterial’, ‘OperatorStop’… |
| lrQualityLoss | LREAL | Quality losses in product count = lrQuantityNOK |
| lrSpeedLoss | LREAL | Speed Losses in product count := (ActualPlanTarget - QuantityOK - QuantityNOK - AvailabilityLoss - PerformanceLoss) |
scProductionDetails
This structure provides detailed information about the active scheduled batch, shift, or product run.
| Name | Type | Comment |
|---|---|---|
| dtStartTime | DT | Start Time of event |
| dtEndTime | DT | End Time of event; Note: During a active schedule it will be updated with dtLocalDateTime and freeze on the end of the schedule |
| tDuration | TIME | Time elapsed since the start |
| diScheduleID | DINT | Shift or Batch run Description ; can be 0 by product run |
| sScheduleDescription | STRING | Shift or Batch run Description ; can be empty string by product run |
| diProductID | DINT | Running product ID |
| sProductDescription | STRING | Product type or ID Description |
| rProductTime | REAL | Part cycle time base don input parameter (60.0 / rProductsPerMin) |
| tActualAllTime | TIME | Actual All Time (Actual time - Schedule start) |
| tPlannedProdTime | TIME | Planned Production Time (Actual All time - Schedule Loss) |
| tRunTime | TIME | Run Time (Planned Production Time - Availability Loss) |
| tNetRunTime | TIME | Net Run Time (Run Time - Performance Loss) |
| tFullyProdTime | TIME | Fully Productive Time (Net Run Time - Quality Loss) |
| tProducing | TIME | Time production is running |
| uiProducing | UINT | Occurrence rate how oftens the production was started |
scProductionLossDetails
This structure provides detailed information about the losses of the active scheduled batch, shift, or product run.
| Name | Type | Comment |
|---|---|---|
| dtStartTime | DT | Start Time of event |
| dtEndTime | DT | End Time of event; Note: During a active schedule it will be updated with dtLocalDateTime and freeze on the end of the schedule |
| eEP_PT | eEP_ProductionState | Output production states as enumeration |
| tUnplannedDowntime | TIME | Total time of unplanned Availability and Performance events |
| uiUnplannedOccurrence | UINT | Total Occurrence rate of unplanned Availability and Performance events |
| tBreak | TIME | Time production is in break and production has stopped |
| tNoDemand | TIME | Time where there is no production demand or order |
| tNone | TIME | Time where no production state is identified |
| tStarvedShort | TIME | Time where upstream is starved e.g. No incoming parts |
| tBlockedShort | TIME | Time where downstream is blocked e.g. No output part transfer |
| tNoMaterialShort | TIME | Time where is No material available for production(e.g. film roll empty) |
| tOperatorStopShort | TIME | Time when the Operator-initiated pause for minor issues (e.g., clearing a jam) |
| tEquipmentFailure | TIME | Time when Emergency or critical fault is active and production has been aborted |
| tNotReady | TIME | Time when the machine has been stopped and wating for restart |
| tOperatorStop | TIME | Time when the Operator-initiated pause for minor issues (e.g., clearing a jam) |
| tStarved | TIME | Time where upstream is starved e.g. No incoming parts |
| tBlocked | TIME | Time where downstream is blocked e.g. No output part transfer |
| tNoMaterial | TIME | Time where is No material available for production(e.g. film roll empty) |
| uiBreak | UINT | Occurrence rate production is in break and production has stopped |
| uiNoDemand | UINT | Occurrence rate where there is no production demand or order |
| uiNone | UINT | Occurrence rate where no production state is identified |
| uiStarvedShort | UINT | Occurrence rate where upstream is starved e.g. No incoming parts |
| uiBlockedShort | UINT | Occurrence rate where downstream is blocked e.g. No output part transfer |
| uiNoMaterialShort | UINT | Occurrence rate where No material is available for production(e.g. film roll empty) |
| uiOperatorStopShort | UINT | Occurrence rate when the Operator-initiated pause for minor issues (e.g., clearing a jam) |
| uiEquipmentFailure | UINT | Occurrence rate when Emergency or critical fault is active and production has been aborted |
| uiNotReady | UINT | Occurrence rate when the machine has been stopped and wating for restart |
| uiOperatorStop | UINT | Occurrence rate when the Operator-initiated pause for minor issues (e.g., clearing a jam) |
| uiStarved | UINT | Occurrence rate where upstream is starved e.g. No incoming parts |
| uiBlocked | UINT | Occurrence rate where downstream is blocked e.g. No output part transfer |
| uiNoMaterial | UINT | Occurrence rate where No material is available for production(e.g. film roll empty) |
scTopState
This structure provides top-state analysis of the duration and occurrences of losses in the active scheduled batch, shift, or product run.
| Name | Type | Comment |
|---|---|---|
| dtStartTime | DT | Start Time of event |
| dtEndTime | DT | End Time of event; Note: During a active schedule it will be updated with dtLocalDateTime and freeze on the end of the schedule |
| scTopStateDur | ARRAY [0..9] OF scTopStateDuration | |
| scTopStateOcc | ARRAY [0..9] OF scTopStateOccurances |
scTopStateDuration
This structure provides the duration of losses in the active scheduled batch, shift, or product run.
| Name | Type | Comment |
|---|---|---|
| eTopStateDurations | eTopState | Top state durations index 0 is longest time |
| tSortOfTime | TIME | Time of State duration |
| rDowntimePercent | REAL | Downtime percent of the total downtime |
scTopStateOccurances
This structure provides occurrences of losses in the active scheduled batch, shift, or product run.
| Name | Type | Comment |
|---|---|---|
| eTopStateOccurrence | eTopState | Top state Occurrence index 0 is most occurrences |
| uiSortOfOccurrence | UINT | Number of Occurrence |
| rDowntimePercent | REAL | Downtime percent of the total downtime |
Enumerations
eProductionState
Defined input production states as enumeration.
| Name | Initial | Comment |
|---|---|---|
| None | 0 | unknowing production state. |
| Producing | 1 | Production is running (Note: e.g. Execute or Running) |
| NoDemand | 10 | Machine is ready to start waiting for Start (Note: Planned downtime e.g. Idle state, No Order). |
| Starved | 20 | Automatic pause triggered by upstream conditions (blocked/starved); (Note: Performance loss e.g. Suspended state). |
| Blocked | 21 | Automatic pause triggered by downstream conditions (blocked/starved); (Note: Performance loss e.g. Suspended state). |
| NoMaterial | 22 | No material (e.g. film roll empty); (Note: Performance loss e.g. Suspended state). |
| EquipmentFailure | 30 | Emergency or critical fault state; stops immediately (Note: Availability loss e.g. Abort state). |
| NotReady | 31 | Safe stopped condition; requires start command (Note: Availability loss e.g. Stopped state). |
| OperatorStop | 32 | Operator-initiated pause for minor issues (e.g., clearing a jam); (Note: Availability loss e.g. Held state). |
eTopState
Defined provided production loss states as enumeration.
| Name | Initial | Comment |
|---|---|---|
| None | 0 | unknowing production state. |
| Starved | 20 | Automatic pause triggered by upstream conditions (blocked/starved); (Note: Performance loss e.g. Suspended state). |
| Blocked | 21 | Automatic pause triggered by downstream conditions (blocked/starved); (Note: Performance loss e.g. Suspended state). |
| NoMaterial | 22 | No material (e.g. film roll empty); (Note: Performance loss e.g. Suspended state). |
| EquipmentFailure | 30 | Emergency or critical fault state; stops immediately (Note: Availability loss e.g. Abort state). |
| NotReady | 31 | Safe stopped condition; requires start command (Note: Availability loss e.g. Stopped state). |
| OperatorStop | 32 | Operator-initiated pause for minor issues (e.g., clearing a jam); (Note: Availability loss e.g. Held state). |
| StarvedShort | 40 | Short automatic pause triggered by upstream conditions (blocked/starved); (Note: Performance loss e.g. Suspended state). |
| BlockedShort | 41 | Short automatic pause triggered by downstream conditions (blocked/starved); (Note: Performance loss e.g. Suspended state). |
| NoMaterialShort | 42 | Short No material (e.g. film roll empty); (Note: Performance loss e.g. Suspended state). |
| OperatorStopShort | 43 | Short Operator-initiated pause for minor issues (e.g., clearing a jam); (Note: Availability loss e.g. Held state). |
eEP_ProductionState
Defined output production states as enumeration.
| Name | Initial | Comment |
|---|---|---|
| None | 0 | unknowing production state. |
| Producing | 1 | Production is running (Note: e.g. Execute or Running). |
| Break | 3 | Active Break / Pause - Performance calculation is on Hold |
| NoDemand | 10 | Machine is ready to start waiting for Start (Note: Planned downtime e.g. Idle state, No Order). |
| Starved | 20 | Automatic pause triggered by upstream conditions (blocked/starved); (Note: Performance loss e.g. Suspended state). |
| Blocked | 21 | Automatic pause triggered by downstream conditions (blocked/starved); (Note: Performance loss e.g. Suspended state). |
| NoMaterial | 22 | No material (e.g. film roll empty); (Note: Performance loss e.g. Suspended state). |
| EquipmentFailure | 30 | Emergency or critical fault state; stops immediately (Note: Availability loss e.g. Abort state). |
| NotReady | 31 | Safe stopped condition; requires start command (Note: Availability loss e.g. Stopped state). |
| OperatorStop | 32 | Operator-initiated pause for minor issues (e.g., clearing a jam); (Note: Availability loss e.g. Held state). |
| StarvedShort | 40 | Short automatic pause triggered by upstream conditions (blocked/starved); (Note: Performance loss e.g. Suspended state). |
| BlockedShort | 41 | Short automatic pause triggered by downstream conditions (blocked/starved); (Note: Performance loss e.g. Suspended state). |
| NoMaterialShort | 42 | Short No material (e.g. film roll empty); (Note: Performance loss e.g. Suspended state). |
| OperatorStopShort | 43 | Short Operator-initiated pause for minor issues (e.g., clearing a jam); (Note: Availability loss e.g. Held state). |
eError
Library Possible Error Codes and Descriptions as enumeration.
| Name | Initial | Comment |
|---|---|---|
| no_error | 0 | No error detected. |
| no_ValidLicense | 10 | No valid license was found. Please verify the library license using DDAS_LM.Get_Lib_License. |
| invalid_LocalDateTime | 21 | Invalid dtLocalDateTime = DT#1970-01-01-00:00:00. |
| invalid_eDayofWeek | 23 | Invalid weekday eDayofWeek = 0 or eDayofWeek > 7. |
| invalid_DateTimeBoundries | 25 | Invalid date and time boundaries = DT#1970-01-01-00:00:00 or dtLocalDateTime = DT#2106-02-07-06:28:15). |
| invalid_InputParameter | 30 | At least one input parameter is zero or lies outside the permissible range.. |
| no_Active_Schedule | 31 | No active schedule was found. |
| productionState_None | 32 | Input production state is None and invalid. need to be set to <> None. |
| drift_ProductCount | 33 | The input part count may drift slightly; this could be normal and will be ignored. |
| negativ_ProductCount | 34 | The input part count is invalid because it is negative; only positive values are allowed. |
| productCount_NoSchedule | 35 | Detected product count during no active schedule. |
| week_overlow | 40 | Batch end behind one week. |
| ltime_overflow | 41 | The calculated LTime value is greater than 1000 days and exceeds the allowed range. |
| time_overflow | 42 | The calculated Time value is greater than 49 days and exceeds the allowed range. |
| invalid_time_diff | 45 | Invalid time difference calculation subtrahend > minuend |
| unknowing_error | 99 | Unknowing error detected. |
Global Variable
GVL_Constant_EP
Library constants.
| Scope | Name | Type | Initial | Comment |
|---|---|---|---|---|
| Constant | uiHistorySize | UINT | 20 | Max. size of historical array storage |
GVL_LibGuide
This Global Variable List provides the library license GUID. Relevant input parameter for the function block DDAS_LM.Get_Lib_License, required to activate the library license in conjunction with the activation key and side code.
| Scope | Name | Type | Initial | Comment |
|---|---|---|---|---|
| Constant | cLibraryGuid | STRING | ‘{LIB-DDAS-FF2F57D0}’ | Unique Library license GUID for use in the user program to activate the library license. |
Example Implementation
The following screenshots illustrate a complete implementation of the library function blocks, including the license function block.
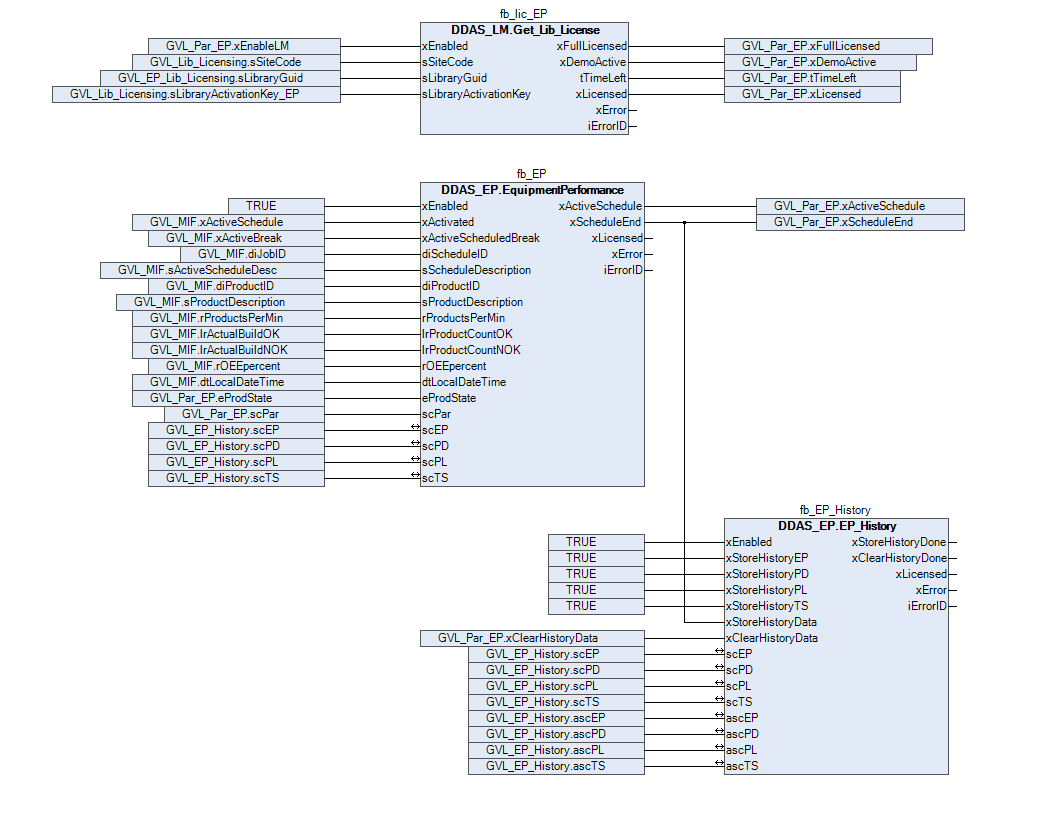
The current local date, time, and day of the week can be obtained using the DDAS function block DDAS_DT.GetDateTimeInfo from the DDAS_DateTime_lib library.
Your Feedback Matters
These instructions have been prepared to the best of our knowledge and belief to provide you with the highest possible level of support when working with our product.
Despite our best efforts, we may not always fully achieve this objective. If you identify any issues or have suggestions for improvement, we would greatly appreciate your feedback.
Please send your comments or criticism in a short e‑mail to:
Thank you for your support.
Your DDAS Application Software Team